1 Assignment
Measure the latency of UDP communication over Ethernet between two boards. Specifically, measure the latency of UDP datagrams with 4 and 1400 bytes payload. Present the results in the form of a latency profile graph (cumulative histogram) similar to the one below.
Since Ethernet uses a non-deterministic medium access protocol, it is not sufficient to measure the delay of only a single packet. More measurements have to be done and then they must be statistically evaluated. One possibility is to create histograms from the measured data.
To measure one-way communication latency between two nodes it is necessary to have synchronized clocks in the sender and receiver. Since this is not our case, we will make use of the fact that the probability distribution of communication latencies is the same in both directions. We will measure the so called round-trip time (a message is sent from node 1 to 2 and back from 2 to 1) and divide the result by two.
Work in couples.
1.1 Solution guidelines
Develop your project as Downloadable Kernel Module for the MZ_APO board.
Name the entry point function void udp_latency(char*, int, int, int):
/*
 * udp_latency()
 *  : (char *) ip_address  -- IPv4 address of the target board for sending data to.
 *                            `NULL` or empty string means run as LISTENER.
 *  : (int) port           -- port used for communication
 *  : (int) payload_size   -- size of the payload in Bytes
 *  : (int) messages_count -- number of messages to be sent/read
 *                            0 = INFINITE
 *
 *  Entry point function.
 *
 *  This function is used for measuring round-trip time of UDP messages.
 *  Depending on the ip_address argument, the application is run as SENDER or LISTENER.
 *  In both versions the application starts with printing `Measurement started` to
 *  stdout and when it finishes it prints `Measurement finished`.
 *
 *  SENDER mode
 *  The application sends UDP packets of `payload_size` size to
 *  the board with IP address `ip_address` using port `port`. After a packet is sent, it waits
 *  for response. The time between sending and receiving the packet is measured, divided
 *  by two and stored in a histogram. After `messages_count` packets are sent and
 *  received, the histogram is printed out and the application finishes.
 *
 *  LISTENER mode
 *  The application is expecting packets of size at most `payload_size` on port `port`.
 *  When a packet is received, it is sent back to the sender.
 *
 *  Histogram data format:
 *
 *  Each line has the format "<name><payload_size>=[<values>]"
 *  - name is 'idx' or 'lat',
 *  - values are numbers separated by commas.
 *
 *   1) The first row with name 'idx' is the x-axis of the histogram,
 *      values are in microseconds, ordered as a strictly increasing
 *      sequence.
 *
 *   2) Second row with name 'lat' contains the counts of packets with
 *      single-trip latency corresponding to the value from the first
 *      row. The sequence has the same number of values as the first
 *      row.
 *
 *  Example:
 *
 *   LISTENER:
 *      -> udp_latency("", 2227, 1400)
 *      Measurement started
 *      Measurement finished
 *
 *   SENDER:
 *      -> udp_latency("10.35.1.2", 2227, 4, 5)
 *      Measurement started
 *      idx4=[0,1,2,3,4,5,6,7,8,9,10,11,12,13,14,15,16,17,18,19,20]
 *      lat4=[0,0,0,0,0,0,0,0,0,0,0,0,0,1,0,0,0,0,1,1,2]
 *      Measurement finished
 */
void udp_latency(char *ip_address, int port, int payload_size, int message_count);
To read high-resolution clock, use:
UINT64 ts;
sysTimestamp64Lock(&ts);
This function allows you to measure the delays with the highest resolution that is available on the hardware. For more information about sysTimestamp64Lock() look into the previous cache assignment.
This time we want you to upload extra files to BRUTE:
histogram.log -- a file that contains the data for plotting the histogram (basically copy-pasted output of your application). It will include 4 lines staring with:
idx4=
lat4=
idx1400=
lat1400=
latency_profile.png/jpg -- a rendered image with the latency profiles calculated from histogram.log data. The x-axis will be labeled in milliseconds, y-axis will be in log scale.
2 Hints
2.1 Histograms
This section discusses several options how to present the measured data in a graphical way. Our goal is to find the best method to emphasize the information that is crucial for real-time applications. The examples graphs are taken from an unrelated project that compares the performance of two CAN bus device drivers.
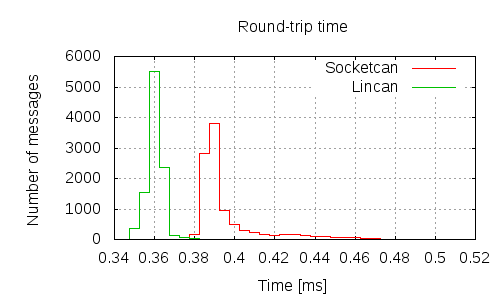
The most common way to visualize the results is to show them in a form of histogram (see below). The disadvantage of plain histograms is that the maximal delay is typically experienced only by a very small number of packets and therefore the maximum is hard to see in the graph. In the graph below, the red line actually ends at 0.505, but it is not visible.
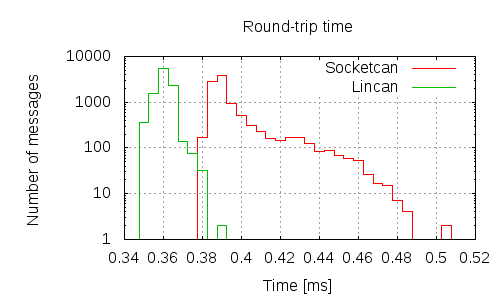
Things can be improved by having the vertical axis in logarithmic scale, but then zero will map to minus infinity and it will be hard to distinguish between zero and one. See the graph below.
Another possibility is to visualize the data in the form of cumulative histogram, which is obtained by integrating the plain histogram over the horizontal axis (see below).
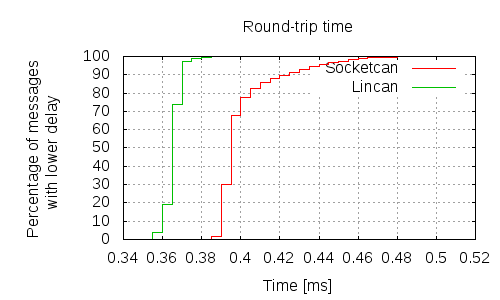
From the cumulative histogram, one can easily see how many messages have the delay lower (or higher) than a certain value, but the maximum is still hard to see.
Finally, the best option is, in our opinion, the so called latency profile, which is a cumulative histogram with reversed vertical axis in logarithmic scale (i.e. the combination of the two previous graphs).
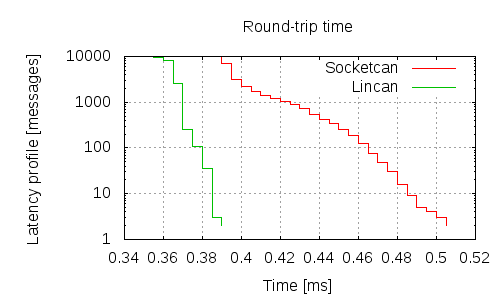
From this plot, the maximum can be seen easily because the worst-case behavior (lower right part), which is important for real-time, is "magnified" by the log scale. In both cases (red and green) the maximum delay was encountered in two cases (the line ends at value 2).
You can use the following code in Julia to plot latency plots as above.
using Plots

function p()
    lat_prof(y) = y |> reverse |> cumsum |> reverse
    plot(title="UDP latency profile", xlab="Latency [ms]", ylab="Count", yaxis=:log, xlim=(0,NaN), ylim=(0.8,NaN))
    plot!(idx4 ./ 1000, lat_prof(lat4), label="4 bytes", linetype=:steppost)
    plot!(idx1400 ./ 1000, lat_prof(lat1400), label="1400 bytes", linetype=:steppost)
end

p()
2.2 BSD sockets API
We assume that you are familiar with basic BSD sockets programming from other courses. You can use the examples below as a reference. The examples can be directly compiled as Real-Time process. In order to compile them as a kernel module you need to add:
#include <inetLib.h>
#include <sockLib.h>
and replace the handling of argv and argc parameters, which are not set automatically in kernel modules.
/* This program listens at a UDP port specified as command line
 * parameter and once it receives a packet it adds "OK!" and sends it
 * back. */

#include <sys/types.h>
#include <sys/socket.h>
#include <netinet/in.h>
#include <arpa/inet.h>
#include <string.h>
#include <stdio.h>
#include <stdlib.h>
#include <unistd.h>

#define MAX_BUF 1024

int main(int argc, char* argv[])
{
  int sockd;
  struct sockaddr_in my_name, cli_name;
  char buf[MAX_BUF];
  int status;
  int addrlen;

  if (argc < 2)
  {
    fprintf(stderr, "Usage: %s port_number\n", argv[0]);
    exit(1);
  }
  /* Create a UDP socket */
  sockd = socket(AF_INET, SOCK_DGRAM, 0);
  if (sockd == -1)
  {
    perror("Socket creation error");
    exit(1);
  }

  /* Configure server address */
  my_name.sin_family = AF_INET;
  my_name.sin_addr.s_addr = INADDR_ANY;
  my_name.sin_port = htons(atoi(argv[1]));

  status = bind(sockd, (struct sockaddr*)&my_name, sizeof(my_name));

  addrlen = sizeof(cli_name);
  status = recvfrom(sockd, buf, MAX_BUF, 0,
      (struct sockaddr*)&cli_name, &addrlen);

  printf("%s", buf);
  strcat(buf, "OK!\n");

  status = sendto(sockd, buf, strlen(buf)+1, 0,
      (struct sockaddr*)&cli_name, sizeof(cli_name));

  close(sockd);
  return 0;
}
/* This program sends "Hello world" string to address and port given
 * as command line parameters, then it wait for any response and
 * prints it. */

#include <sys/types.h>
#include <sys/socket.h>
#include <netinet/in.h>
#include <arpa/inet.h>
#include <string.h>
#include <stdio.h>
#include <stdlib.h>
#include <unistd.h>

#define MAX_BUF 100

int main(int argc, char* argv[])
{
  int sockd;
  struct sockaddr_in my_addr, srv_addr;
  char buf[MAX_BUF];
  int count;
  int addrlen;

  if (argc < 3)
  {
    fprintf(stderr, "Usage: %s ip_address port_number\n", argv[0]);
    exit(1);
  }
  /* Create a UDP socket */
  sockd = socket(AF_INET, SOCK_DGRAM, 0);
  if (sockd == -1)
  {
    perror("Socket creation error");
    exit(1);
  }

  /* Configure client address */
  my_addr.sin_family = AF_INET;
  my_addr.sin_addr.s_addr = INADDR_ANY;
  my_addr.sin_port = 0;

  bind(sockd, (struct sockaddr*)&my_addr, sizeof(my_addr));

  strcpy(buf, "Hello world\n");

  /* Set server address */
  srv_addr.sin_family = AF_INET;
  inet_aton(argv[1], &srv_addr.sin_addr);
  srv_addr.sin_port = htons(atoi(argv[2]));

  sendto(sockd, buf, strlen(buf)+1, 0,
      (struct sockaddr*)&srv_addr, sizeof(srv_addr));

  addrlen = sizeof(srv_addr);
  count = recvfrom(sockd, buf, MAX_BUF, 0,
      (struct sockaddr*)&srv_addr, &addrlen);
  write(1, buf, count);

  close(sockd);
  return 0;
}
